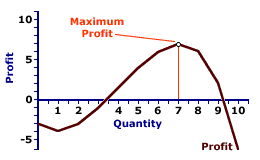
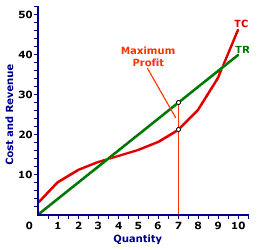
A perfectly competitive firm is presumed to produce the quantity of output that maximizes economic profit--the difference between total revenue and total cost. This production decision can be analyzed directly with economic profit, by identifying the greatest difference between total revenue and total cost, or by the equality between marginal revenue and marginal cost.
| Profit Maximization Profit Curve |
|---|
 |
| Total Curves |
 |
| Marginal Curves |
 |
Three Views
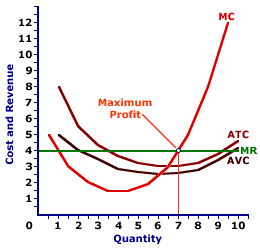
Profit-maximizing output can be identified in one of three ways--directly with economic profit, with a comparison of total revenue and total cost, and with a comparison of marginal revenue and marginal cost.This exhibit illustrates how it can be identified for a perfectly competitive firm, such as that operated by Phil the zucchini growing gardener. Phil sells zucchinis in a market with gadzillions of other zucchini growers and thus faces a going market price of $4 for each pound of zucchinis sold.The top panel presents the profit curve. The middle panel presents total revenue and total cost curves. The bottom panel presents marginal revenue and marginal cost curves. In all three panels, Phil maximizes when producing 7 pounds of zucchinis.
More on the Marginal View
Further analysis of the marginal approach to analyzing profit maximization provides further insight into the short-run production decision of a perfectly competitive firm.First, consider the logic behind using marginals to identify profit maximization.- Marginal revenue indicates how much total revenue changes by producing one more or one less unit of output.
- Marginal cost indicates how much total cost changes by producing one more or one less unit of output.
- Profit increases if marginal revenue is greater than marginal cost and profit decreases if marginal revenue is less than marginal cost.
- Profit neither increases nor decreases if marginal revenue is equal to marginal cost.
- As such, the production level that equates marginal revenue and marginal cost is profit maximization.
| Profit Maximization, The Marginal View |
|---|
 |
- Marginal Revenue: Because Phil is a price taker, his marginal revenue curve is a horizontal line. Click the [Marginal Revenue] button to reveal this curve. It is perfectly elastic at the going market price of $4 per pound of zucchinis.
- Marginal Cost: The marginal cost curve is U-shaped, reflecting the principles of short-run production. Click the [Marginal Cost] button to add this curve to the diagram. It has a negative slope for small amounts of output, then the slope is positive for larger quantities due to the law of diminishing marginal returns.
- Profit Maximization: Profit is maximized at the quantity of output found at the intersection of the marginal revenue and marginal cost curves, which is 7 pounds of zucchinis. Click the [Profit Max] button to highlight this production level. This is the same profit-maximizing level identified using the total revenue and total cost curves and the profit curve.
- If marginal revenue is greater than marginal cost, as is the case for small quantities of output, then the firm can increase profit by increasing production. Extra production adds more to revenue than to cost, so profit increases.
- If marginal revenue is less than marginal cost, as is the case for large quantities of output, then the firm can increase profit by decreasing production. Reducing production reduces revenue less than to it reduces cost, so profit increases.
- If marginal revenue is equal to marginal cost, then the firm cannot increase profit by producing more or less output. Profit is maximized.